Facebook’s rollout points to mental-health harm
Stronger adjustment shrinks the estimate. A credible comparison trend still carries the causal claim.
vizmaya desk · 4 November 2026
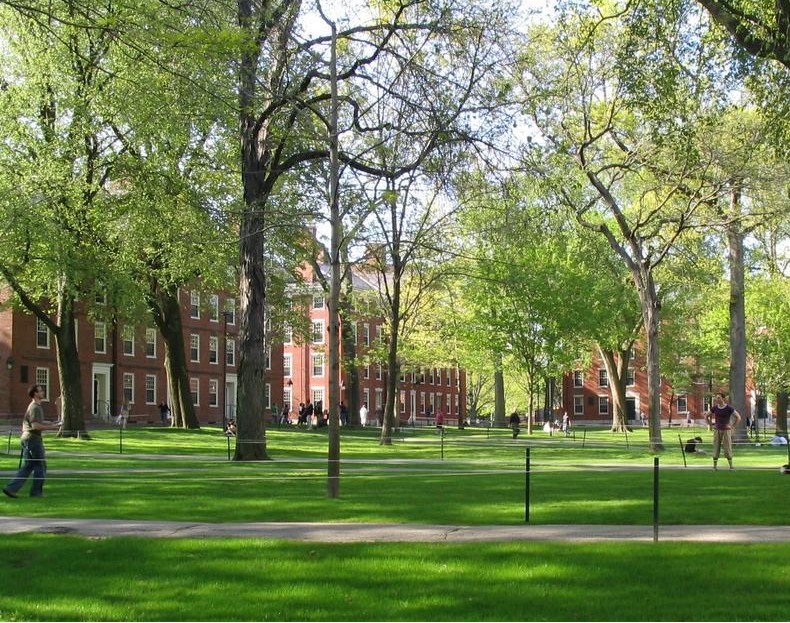
Photo: Mancala / Wikimedia Commons, public domain.
What exactly did this study test?
#17 · Natural experiment
Luca Braghieri, Ro’ee Levy and Alexey Makarin linked campus Facebook access to repeated student surveys.
The treatment was availability on campus. The researchers did not observe each student’s Facebook use.
Social media and mental health
American Economic Review · 2022
United States colleges · rollout, 2004–2006
More than 430,000 survey responses; 359,827 observations in the preferred regression.
How much worse was mental health?
The preferred estimate is a 0.085 standard-deviation increase in the poor-mental-health index after campus access.
That is about nine hundredths of the pre-access spread in scores, not an 8.5% rise in diagnoses.
standard deviations
No estimated change1 SD
Pre-access spread
Higher index = poorer mental health.
Benchmark: the pre-access standard deviation.
How much does adjustment change the estimate?
The estimate falls from 0.137 to 0.085 SD with the preferred adjustment, then to 0.077 SD with rollout-group trends.
These are four model specifications, not raw before-and-after rates. The sample changes between the first two.
Points: estimates. Whiskers: approximate 95% intervals, estimate ± 1.96 × clustered SE.
What could two percentage points look like?
The authors’ model translates the effect into about 27 in 100 screening positive for depression, versus a 25 in 100 baseline.
A prediction using external validation, not observed diagnoses.
Each figure = 1 of 100 · illustrative translation
When were access and symptoms measured?
Survey waves ran from spring 2000 to spring 2008. Access arrived in between; some symptom questions recalled the previous school year.
pp. 3661, 3667–3672; notes 11 and 15 · chronology, not eight outcome estimates
How does staggered access create a comparison?
Compare mental-health changes around rollout with changes where access status stays the same.
College effects absorb lasting campus differences; survey-wave effects absorb shared time shocks. These are repeated cross-sections, not the same students followed over time.
Would the trends have stayed parallel?
Without Facebook, campuses must have followed parallel mental-health trends.
The event study found no discernible pre-rollout trend. That supports the comparison; it cannot rule out a new competing change at rollout. Earlier campuses were not randomly selected.
What do the observational estimates add?
Nagata and colleagues found small same-wave correlations, r = 0.02–0.06, and prospective within-person associations, β = 0.07 and 0.09.
These are six estimates from one cohort, not six studies. The two scales answer different questions.
Nagata et al. 2025 · Table 2 and results; n = 11,876 at baseline
Benchmarks: zero association. Whiskers show reported 95% CIs for β; CIs for r are not supplied in this research.
What do stronger designs add?
Campus access was estimated to worsen mental health by 0.085 SD. Randomized deactivation improved well-being by 0.09 SD.
Allcott’s four-week experiment also improved reverse-coded depression by 0.09 SD. Different outcomes and samples prevent ranking.
Braghieri · Table 1; college sample n = 359,827
Allcott · §4.3, accepted manuscript; recruited Facebook users
Separate outcome scales; zero = no effect. Rollout interval is approximate. Allcott intervals are unavailable in the supplied research.
Could another change explain the pattern?
A rollout-timed campus change could independently worsen distress or change who responds.
Composition checks reduce this concern, but cannot eliminate it. Social comparison is a suggested pathway, not an experimentally isolated mechanism.
How far does the result travel?
The National Academies did not find established population-level causal effects on adolescent health.
Odgers describes the screen-time explanation for rising teen distress as equivocal. Neither assessment directly refutes the campus estimate.
Where does that leave the evidence?
The collection’s theme verdict is “Large, mostly correlational; growing experimental base.” Here, a conditional causal finding sits alongside smaller observational associations and a distinct deactivation experiment.
Editorial synthesis of claims 3–5, 9, 11 and 19. Theme verdict attributed to the supplied annotated collection. This study does not estimate effects on young children or today’s platforms.
Sources and claims log
Go further
What made the page
21 audited claims. “Verified” means source-supported, not assumption-free.
The 7% / 20% relative figures and citation counts were withheld. No preregistration, exact event-study series or direct replication was verified. Full Odgers text was inaccessible.
Nine cross-design estimates come from three studies. Their scales are kept separate. Derived intervals use estimate ± 1.96 × SE.
Study credit and reading notes
Study: Braghieri, L., Levy, R., & Makarin, A. (2022). Social media and mental health. American Economic Review, 112(11), 3660–3693. doi:10.1257/aer.20211218.
Selected from: Social Media and Its Effects on People and Society: An Annotated Research Collection (2026 edition). Citation counts: OpenAlex (CC0).
Citation metadata supplied 4 November 2026; counts withheld pending verification.
Sources & method
Hero: Harvard Yard by Mancala, Wikimedia Commons, public domain. A context photograph, not historical evidence of rollout.
Charts are original redraws from the supplied verified research. No effects are pooled. No raw before-and-after diagnostic rates are implied.
Explore more vizmaya evidence stories
Research checked: 4 November 2026.
By vizmaya desk.